We’re about to find out.
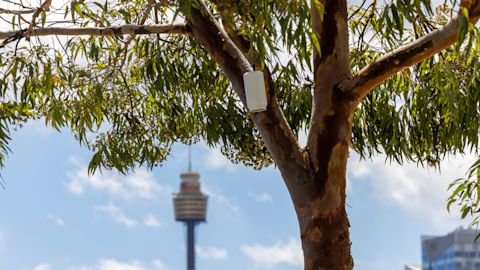
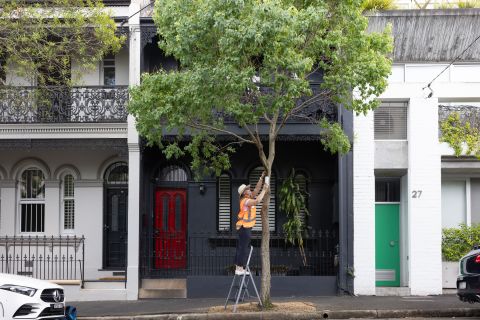
We’ve installed 200 bespoke temperature gauges across our local area to measure heat and humidity to help prepare us for hotter summers.
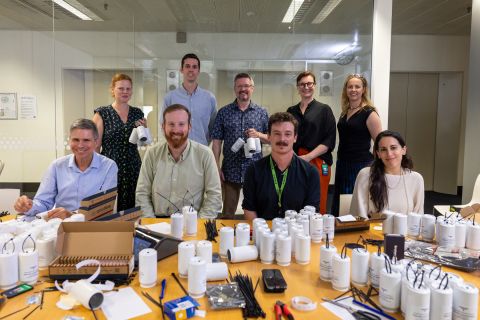
The study is being carried out with Western Sydney University and it’s the first time a local government area in Sydney’s east has been mapped in this way.
“This important study will identify microclimates and help us understand where we can concentrate the most appropriate heat adaptation actions. It’ll also help us understand what is working already and inform the development of more cooling strategies to help our communities mitigate the worst impacts of rising temperatures,” Lord Mayor of Sydney, Clover Moore AO said.
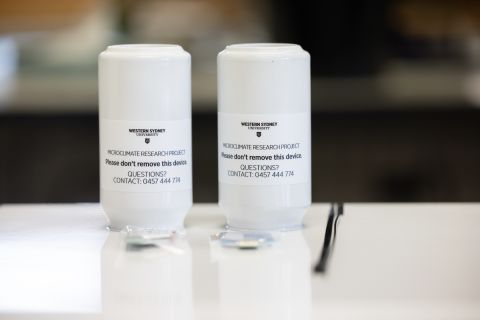
The air temperature loggers used in the study are shielded from direct solar radiation inside reusable and passively ventilated white aluminium cans.
They record temperatures every 10 minutes and will provide more than 3 million data points throughout the study, which runs until March 2024.
Some of the loggers will also measure relative humidity which can gauge the so-called ‘feels like’ temperature.
Project lead researcher Dr Sebastian Pfautsch from the Urban Transformations Research Centre at Western Sydney University has studied the impacts of summer heat for years in the west.
“It is absolutely necessary to begin benchmarking the impacts of heat in the eastern part of our great city,” Dr Sebastian Pfautsch said.
“Without a refined understanding of the urban microclimate, its hotspots and cool zones, workers and local populations are left defenceless when extreme heat strikes. The question is not if the city centre will ever see 45°C, but rather how well the city is prepared to care for its people when the mercury hits new records.”
The loggers are positioned in areas with varying levels of canopy cover, as well as near hard infrastructure like roads and buildings, to measure the varying temperatures.
We’ve set ambitious goals for our area to be net zero by 2035. We also aim to increase tree canopy cover to 27% and green cover to 40% by 2050.
Findings of the study are expected to be completed in late 2024.
Published 11 December 2023, updated 28 February 2024