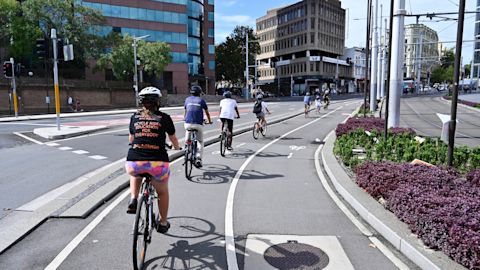
Lord Mayor of Sydney Clover Moore attributed the increase to the expansion of cycling infrastructure throughout the city.
“Since 2007 we have built 25km of safe, separated cycleways including pop-ups, 60km of shared paths and 40km of other cycling infrastructure,” the Lord Mayor said.
“In the past year, we’ve opened new separated cycleways on more than 15 streets including at Waterloo, Erskineville, and Green Square.”
Over the next year, we’ll add to this network with the highly anticipated Oxford Street cycleway and the extension of existing cycleways on Castlereagh and Liverpool streets, among others.
Our busiest intersections in 2022/23 were:
- Oxford Street/Flinders Street/Bourke Street – 2,701 trips per day during peak hours
- Oxford Street/Lang Road/Moore Park Road/Queen Street – 2,378 trips per day during peak hours
- Pyrmont Bridge Road/Murray Street/Pyrmont Bridge – 2,057 trips per day during peak hours
- King Street/Kent Street – 2,037 trips per day during peak hours

Bike trip numbers rising
Trips by bike across the local area were up 18% at peak hours compared to 2022.
Several intersections showed a huge increase in bike path use since counts started in 2010:
- Campbell and Euston roads intersection, up by 609%
- Kent and Druitt streets intersection, up by 602%
- Castlereagh and Goulburn streets intersection, up by 449%
- Wellington and George streets intersection up, by 435%
- Liverpool and George streets intersection, up by 427%
The permanent 24-hour counters on some of our cycleways show similar increases for total daily trips. For example, Bourke Street cycleway in Surry Hills has a daily average of 1,616 bike trips this year, up 41% on last year and higher than all previous years. Castlereagh Street cycleway has a daily average of 862 bike trips this year, up 47% on last year.
Our 2022-23 budget sets aside over $69 million for bicycle related works over the next four years, spending on average $17.35 million per year on cycle infrastructure.
For those interested in making the switch to bike-riding, we offer confidence-building cycling in the city courses, and bike care and maintenance classes at the Sydney Park Cycling Centre.
View more details more about cycling in the city.
Published 6 June 2023


