If you love old maps, check out the Historical Atlas of Sydney.
Published 12 March 2019, updated 11 March 2022
More on
Circular QuayCustoms House
From finding an easy bike route to tracking sharks, maps continue to be popular and important. Find the hidden detail in these representations of Sydney.
This map was a vital tool used by mariners to navigate rocky islands, shoals and tidal variations.
In 1857, the waters around Port Jackson were surveyed by members of the English Royal Navy. Bathymetric ‘soundings’ (depth measurements of water) were made using a weighted line that was lowered over the side of the boat until it hit the sea floor. The length of the line was recorded as the measurement of depth.

Sydney Ports ensures shipping lanes and berthing areas in Sydney Harbour are free of obstacles to avoid disrupting water traffic, shipping timetables or damaging vessels. 3D mapping is used to create ‘maps’ of the sea floor. The colours represent different depths: orange in the shallow areas, moving through to blue and purple in the deepest parts.
Along with shopping trolleys, motorbikes and brand new cars, shipwrecks are visible on the sea floor. Perhaps the most interesting wreck is the TSS Currajong, a collier which sank off Bradleys Head near Mosman in 1910 after being hit by the much larger steam ship, SS Wyreena, a 6,000 tonne passenger liner.
Sydney Harbour Trust commissioners helped manage, improve and preserve the Port of Sydney. The trust had the power to regulate the movement of vessels and the handling of cargo in the Port of Sydney.
Sydney Cove eventually became overcrowded and unsuitable for large ships, like the steam ships pictured here. Darling Harbour became an important ‘working’ harbour because it has deeper water and a nearby rail freight service.
The NSW Government’s shark tagging program is possibly the largest in the world. Scientists track the movement of sharks in real time and look for patterns to help increase our understanding of shark behaviour.
This visualisation was created using data collected by the CSIRO Fisheries Research Centre. Using a grid of 48 listening stations, individual sharks are identified when they pass within 400m of a listening station.

The Indicator Map of Sydney enabled its users to find over 1,300 streets, parks and buildings. The pivot arm is centred on Central railway station and marked with numbers according to the index and a scale. It could be turned to identify the walking distance to your desired location. This map is an early forerunner to today’s drop pin function on mobile app maps.

This map was published in a popular German magazine in 1880. On the western edge of the Botanic Garden you can see the domed Garden Palace.
This was the venue for the Sydney 1879 International Exhibition. Over 7 months, 1.1 million visitors flocked to see exhibits from 23 countries. Exhibits covered mining and metallurgy innovations, education and science, manufactured products, art, machinery, agriculture and horticulture.
Sadly, the Garden Palace burnt to the ground in 1882. Some exhibits were salvaged and form part of today's Museum of Applied Arts and Sciences collection.
Zoom in to see the exquisite detail.

Surveyor H. Percy Dove undertook a comprehensive survey of the city’s buildings in 1879. Insurance companies used his maps to rate the fire risk of each building. Dove’s coding is as follows: SH for a shingle roof; pink for brick and stone; blue for iron, and yellow for wood. Look at the numbers in the circles to discover how many storeys each building contained.
See if you can find the building material used for the construction of Hinchcliff’s Wool Store on Elizabeth Street.

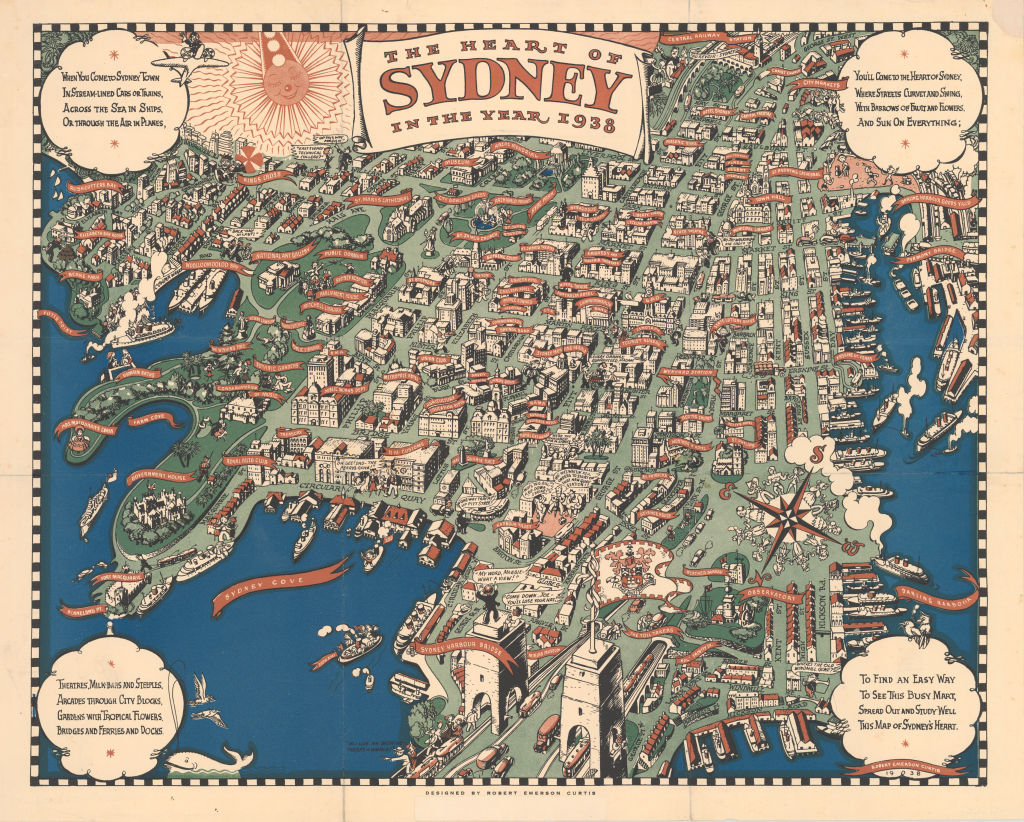
In 1938, Sydney celebrated the 150th anniversary of British settlement. This bird’s-eye view of Sydney was produced as a poster commemorating the anniversary. It was created by artist and illustrator, Robert Emerson Curtis. At one time an official war artist, Curtis is best-known for his documentation of the construction of two of Sydney’s landmarks – the Sydney Harbour Bridge and the Sydney Opera House.
Zoom in to see the whimsical characters and comments hidden among the buildings.
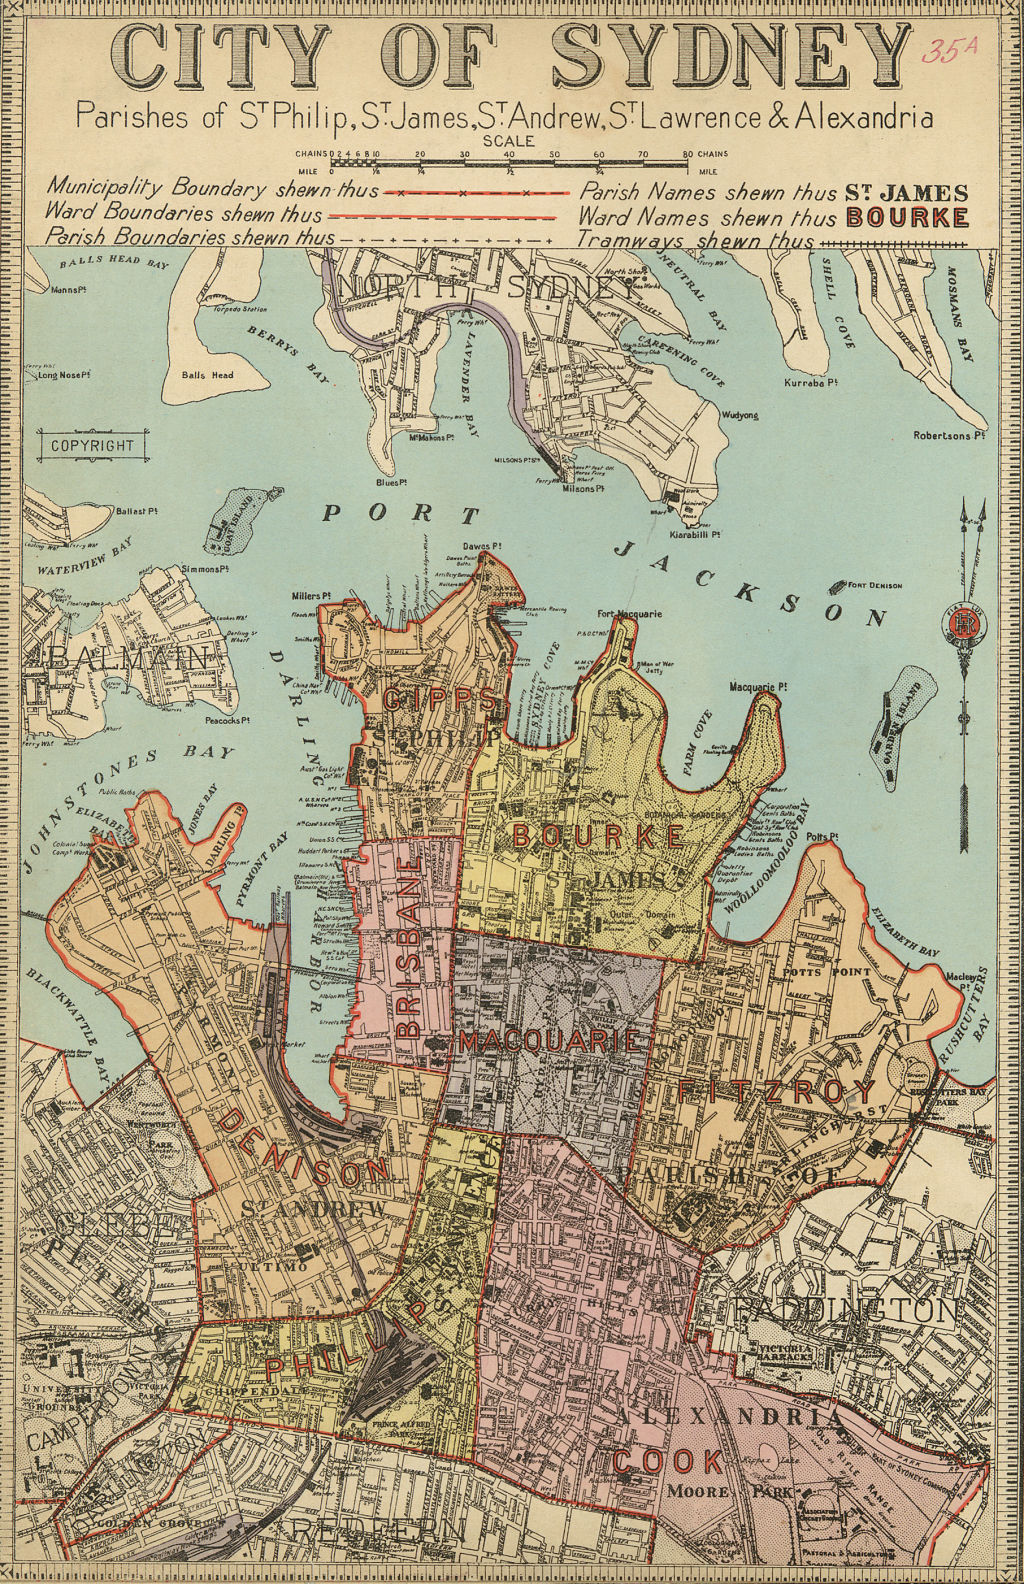
By the end of the 19th century, Sydney had become one of the largest cities in the western world, creating high demand for land acquisition and in turn, a commercial market for maps. This map shows the parishes of St Phillip, St James, St Andrew, St Lawrence and Alexandria around 1889 to 1894. These were references to land divisions (wards), rather than religious parishes.
The City of Sydney originally had 6 wards which increased to 8 when boundaries changed. In those days, voters in each ward elected 4 councillors directly. One councillor from each ward had to retire each year which meant yearly elections were held to maintain the total of 24 councillors. Councillors elected 6 aldermen, who could be chosen from their own ranks or from outside the council. Three of the aldermen had to retire every 3 years. Councillors and aldermen elected the Mayor who held office for 1 year. The City no longer has wards or councillors representing specific parts of the area.
In 1900, the NSW government called for tenders for a bridge across Sydney Harbour. Thirty responses were submitted and displayed in the Queen Victoria (markets) building. This drawing by little-known E Le Bihan proposed multiple arches and a sweeping flyover extending over the northwestern part of the city. It was a progressive approach, anticipating the rise of motor travel and the need to reduce congestion in the city.
Zoom in to see the surprising detail.

Spatial mapping is a popular tool for today’s cartographers. Merging the real and virtual worlds, it turns raw data into enlightening 2 and 3D graphic formats.
Using data collected by the City of Sydney and the NSW Government, this data projection shows the flow of cyclists in and around the city. This type of mapping helps planners understand where additional facilities are required.

Charles Alexandre Leseur (1778 – 1846) was a French naturalist, artist and explorer who travelled to Australia on an expedition led by Nicolas Baudin. Looking at the centre of this map you can see he has drawn the Old Sydney Burial Ground which, at the time, was on the outskirts of the town.
Another member of Baudin’s expedition, François Peron, wrote a detailed report for his superiors in France. He noted the advantages Britain would gain from having a thriving colony on the edge of the Pacific Ocean with ample territory to expand. Peron’s report ends recommending the colony of New South Wales “…should be destroyed as soon as possible”.

This image references the introduction of Australian National Airways, the first commercial air service to carry mail and passengers to Brisbane in 1932. Drawn by artist, designer and illustrator Adrian Feint, you can see the City of Sydney’s 1908 coat of arms: “I take but I surrender”.
A commercial artist, then later an oil painter, Feint is best known for his book plate designs. An exhibition of his bookplate work was held at the Library of Congress, Washington DC in 1930. Remarkably handsome, with a reputation for impeccable taste, Feint lived austerely in a flat in Elizabeth Bay until his death in 1971.
If you love old maps, check out the Historical Atlas of Sydney.
Published 12 March 2019, updated 11 March 2022